Used-Car Price Modeling for Three Rivers Auto
December 7th, 2024 by Michelle Star
This is an abridged version of my Machine Learning final project, where I compare learning models to predict used-car prices and identify the factors that most strongly drive price.
Project brief
Three Rivers Auto asked for two things:
1) understand which features most drive used-car price, and
2) ship a model that predicts price for 1,000 unseen listings.
Data: 1,809 training rows with log(price) and car features; 1,000 test rows without price.
TL;DR
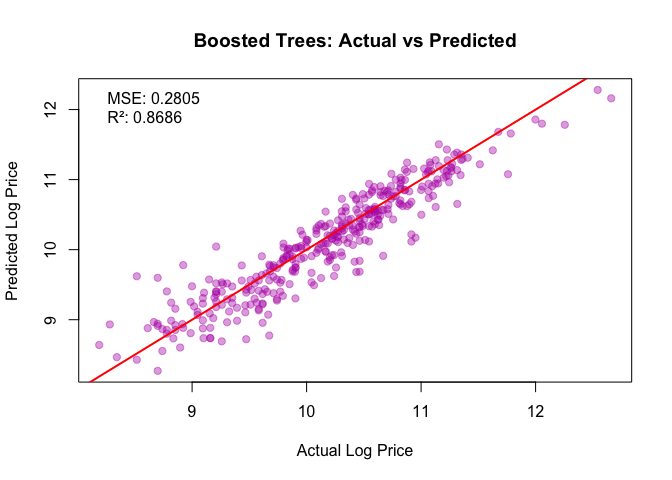
- Best model: Gradient Boosted Trees (GBM) — RMSE 0.2805, R² 0.8686.
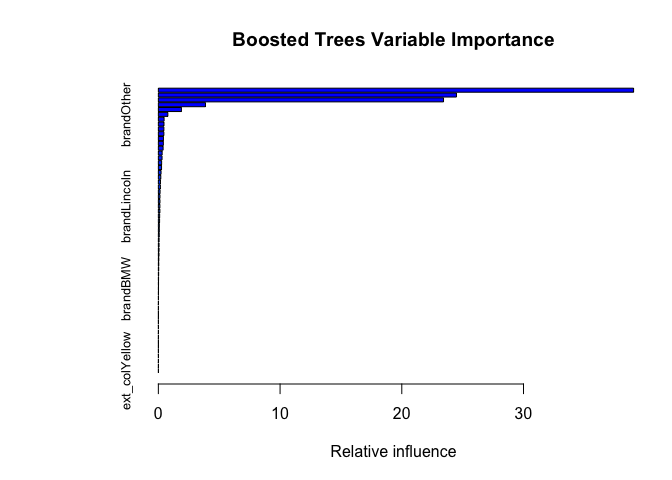
- Most important signals: mileage ↓, model year ↑, horsepower ↑ then plateaus, and brand premiums (Porsche, Lexus, Toyota).
- Color, transmission type, and accident flags had limited incremental value.
Dataset and checks
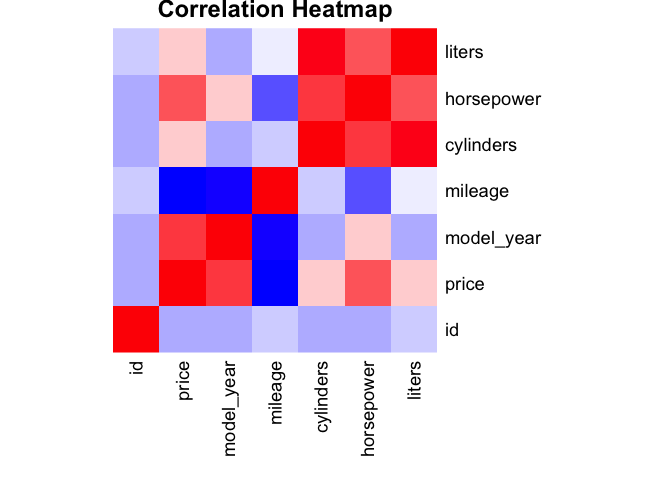
No missing values. Wide ranges for mileage (to 405k) and horsepower (to 760).
Correlation snapshot:
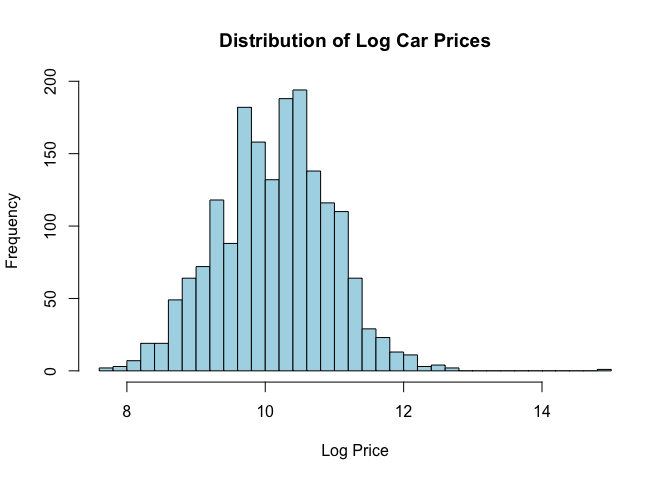
Price is log-scaled. Distribution below:
Exploratory patterns
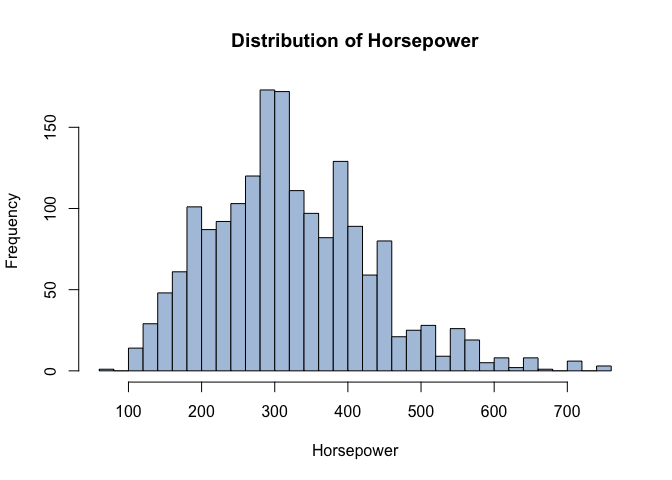
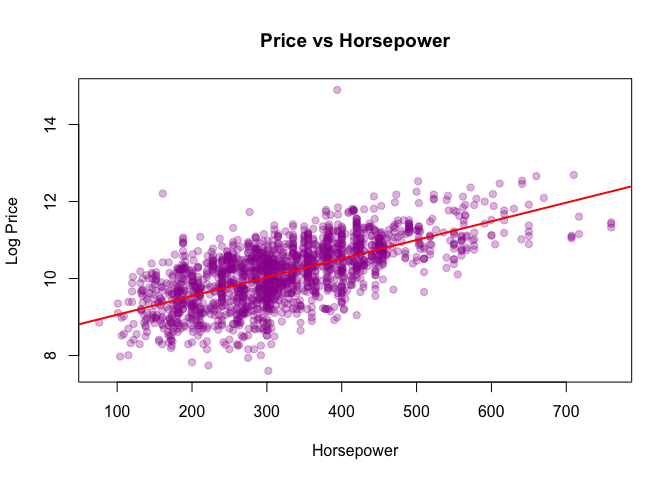
Horsepower
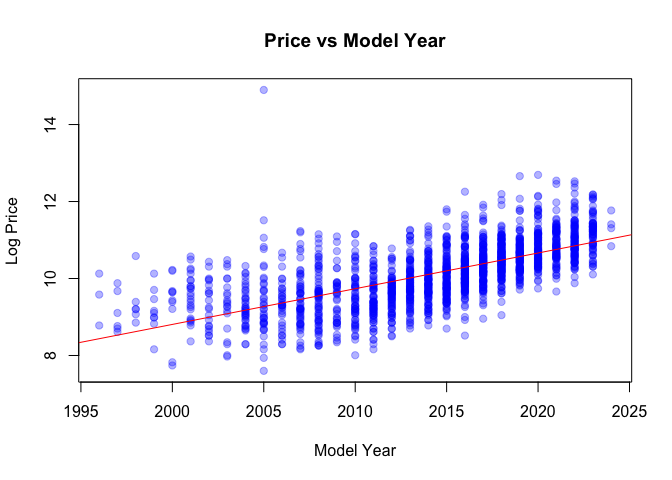
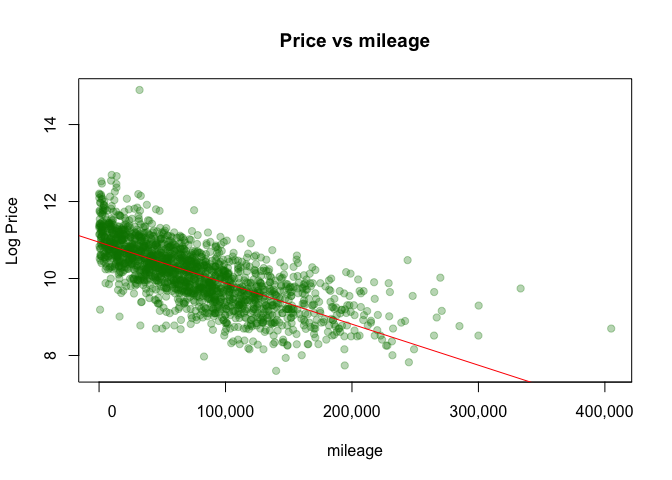
Model year and mileage
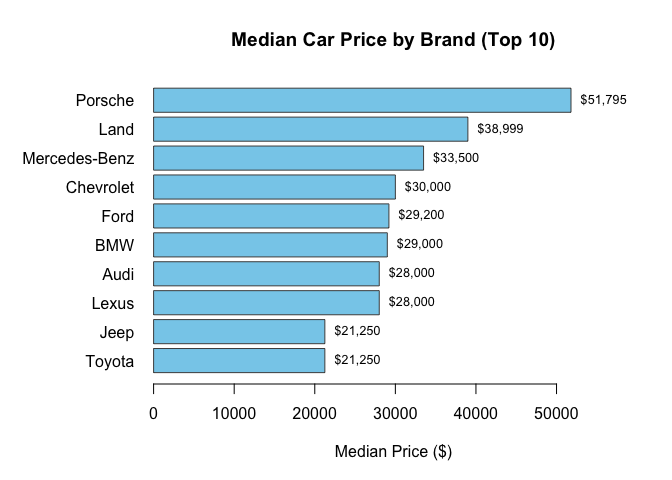
Brand and color
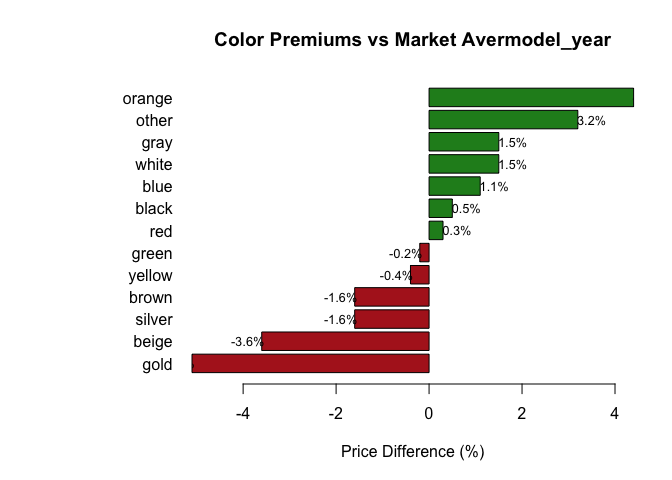
Takeaways: newer cars and lower mileage command higher prices; brand effects persist after controls; extreme HP has diminishing returns.
Modeling approach
Train/test split 80/20 on log(price). Compared:
- Linear, Ridge, Lasso
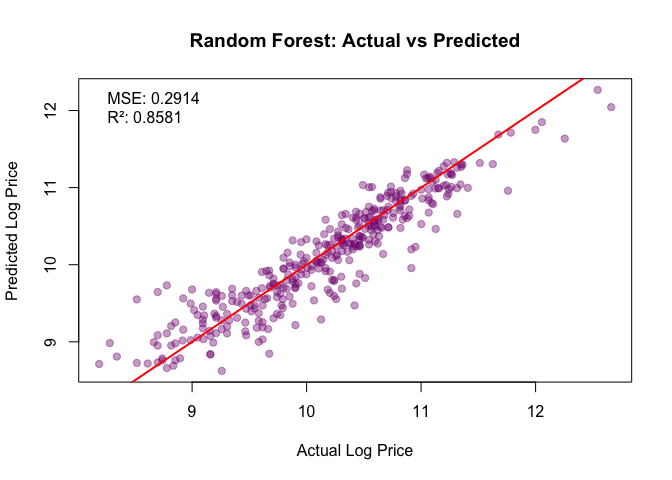
- Random Forest (RF)
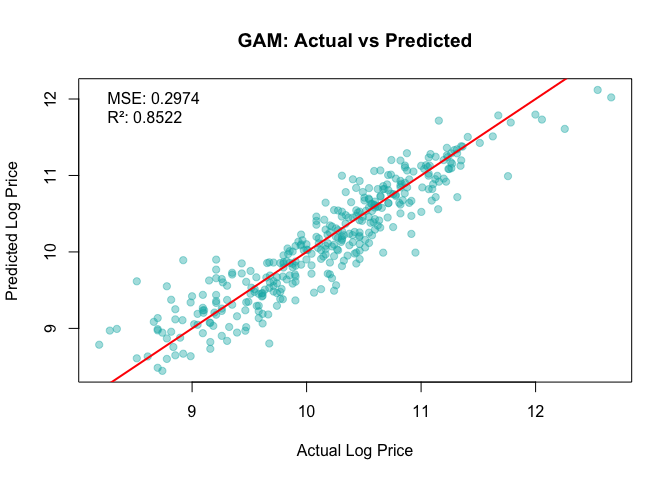
- Generalized Additive Model (GAM)
- Gradient Boosted Trees (GBM)
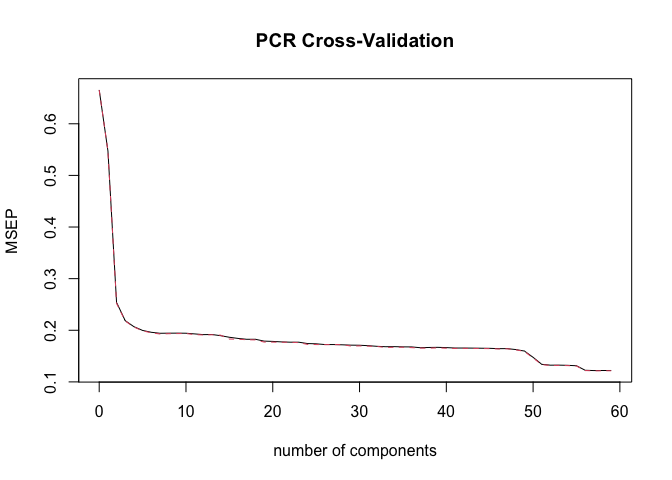
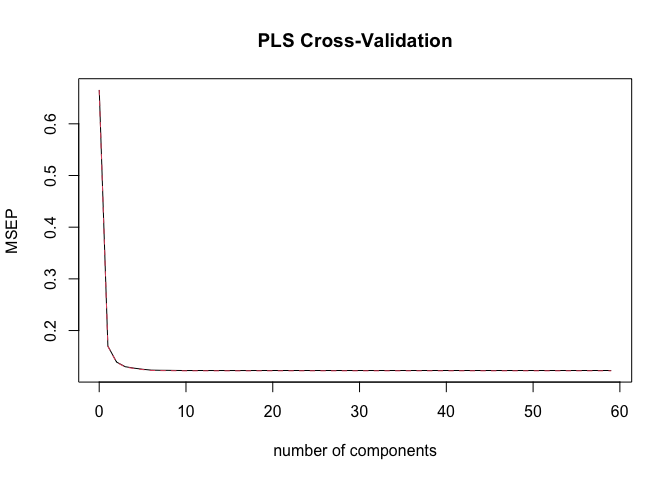
- Classical feature screens: Best Subset, Stepwise, PCR, PLS
Cross-validation examples:
Results
Model comparison
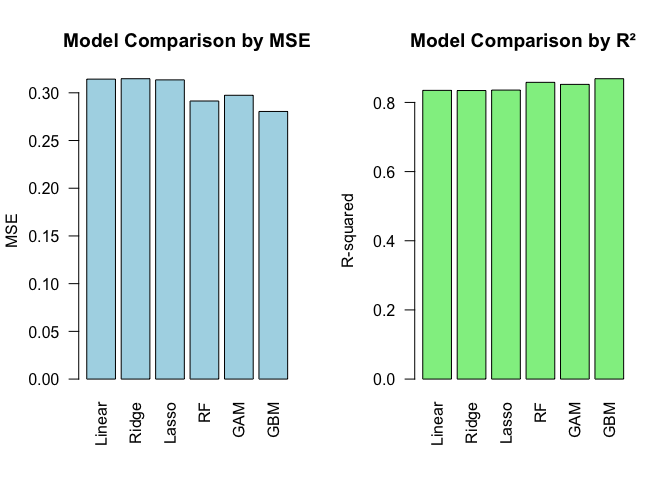
Best model: GBM
Benchmarks
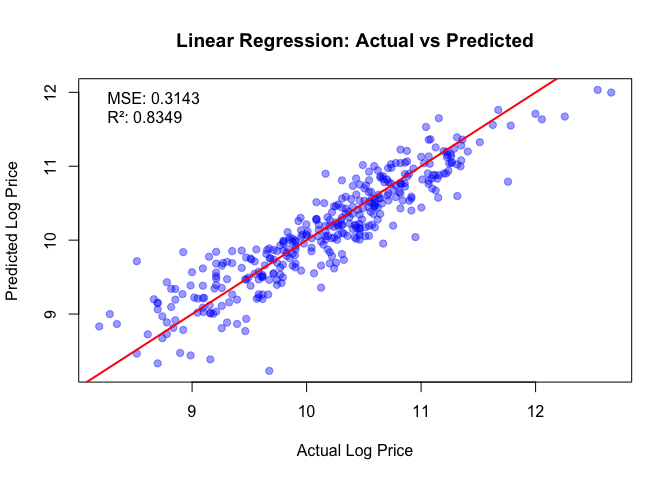
- Linear/Ridge/Lasso: good but miss nonlinearity.
- RF and GAM: competitive, interpretable effects.
What drives price (business view)
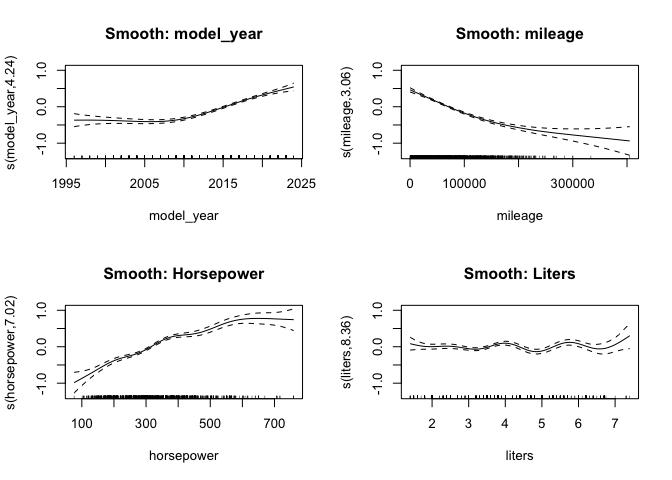
- Mileage dominates: large, monotonic drop from ~50k to 100k; tapering beyond 200k.
- Model year: step-up for ~2015+ inventory.
- Powertrain: horsepower helps until mid-high ranges; diminishing returns afterward.
- Brand equity: Porsche, Lexus, Toyota retain value; Dodge/Chrysler lag.
- Low-leverage features: color, transmission label, accident flag add little once core factors included.
Limitations and next steps
- Tail errors: more variance on very cheap cars; rare categories (e.g., colors) are sparse.
- Add features if available: condition grades, owners, service history, trim, options, market signals.
- Monitor drift; retrain with newer sales cycles.
Appendix: more figures
Linear residuals: 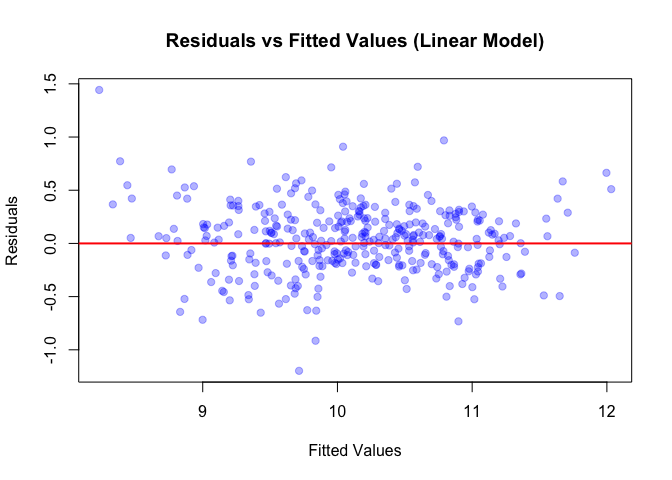
Linear standardized importance: 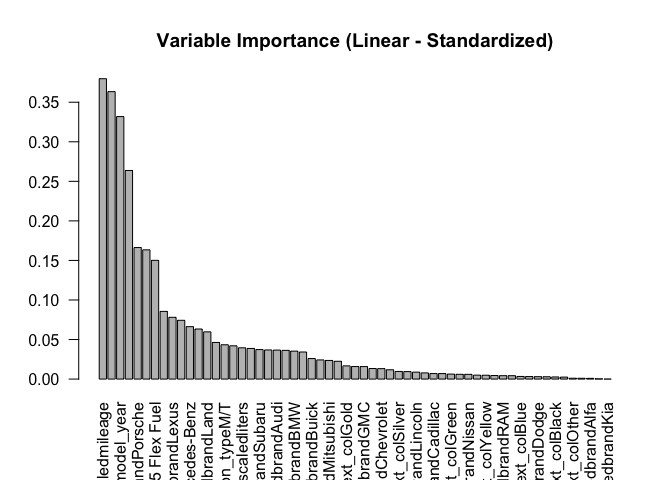
Ridge A vs P: 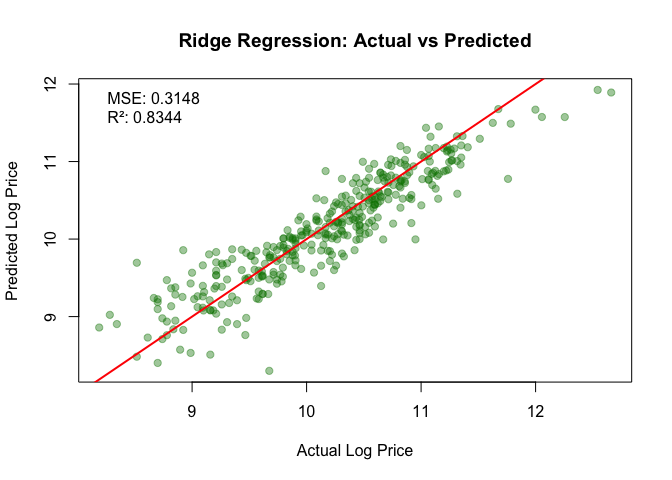
Lasso A vs P: 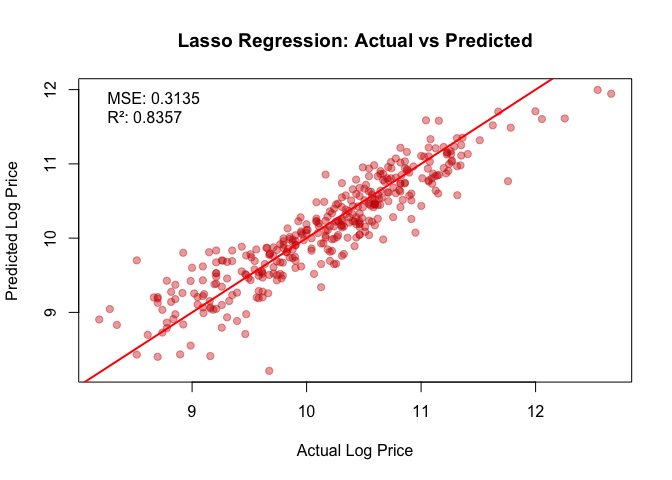
GBM CV curve: 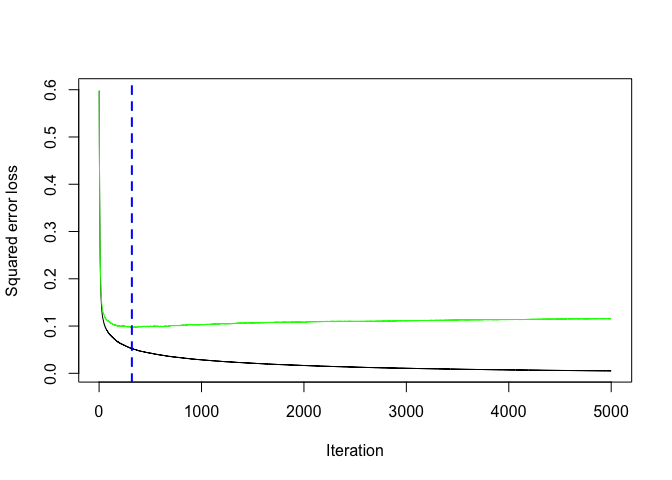
Files produced
- Predictions CSV:
id, pricefor 1,000 test cars (log-price). - Code: single R file with all steps and seeds.