Best Neighborhood
December 10th, 2022 by Michelle Star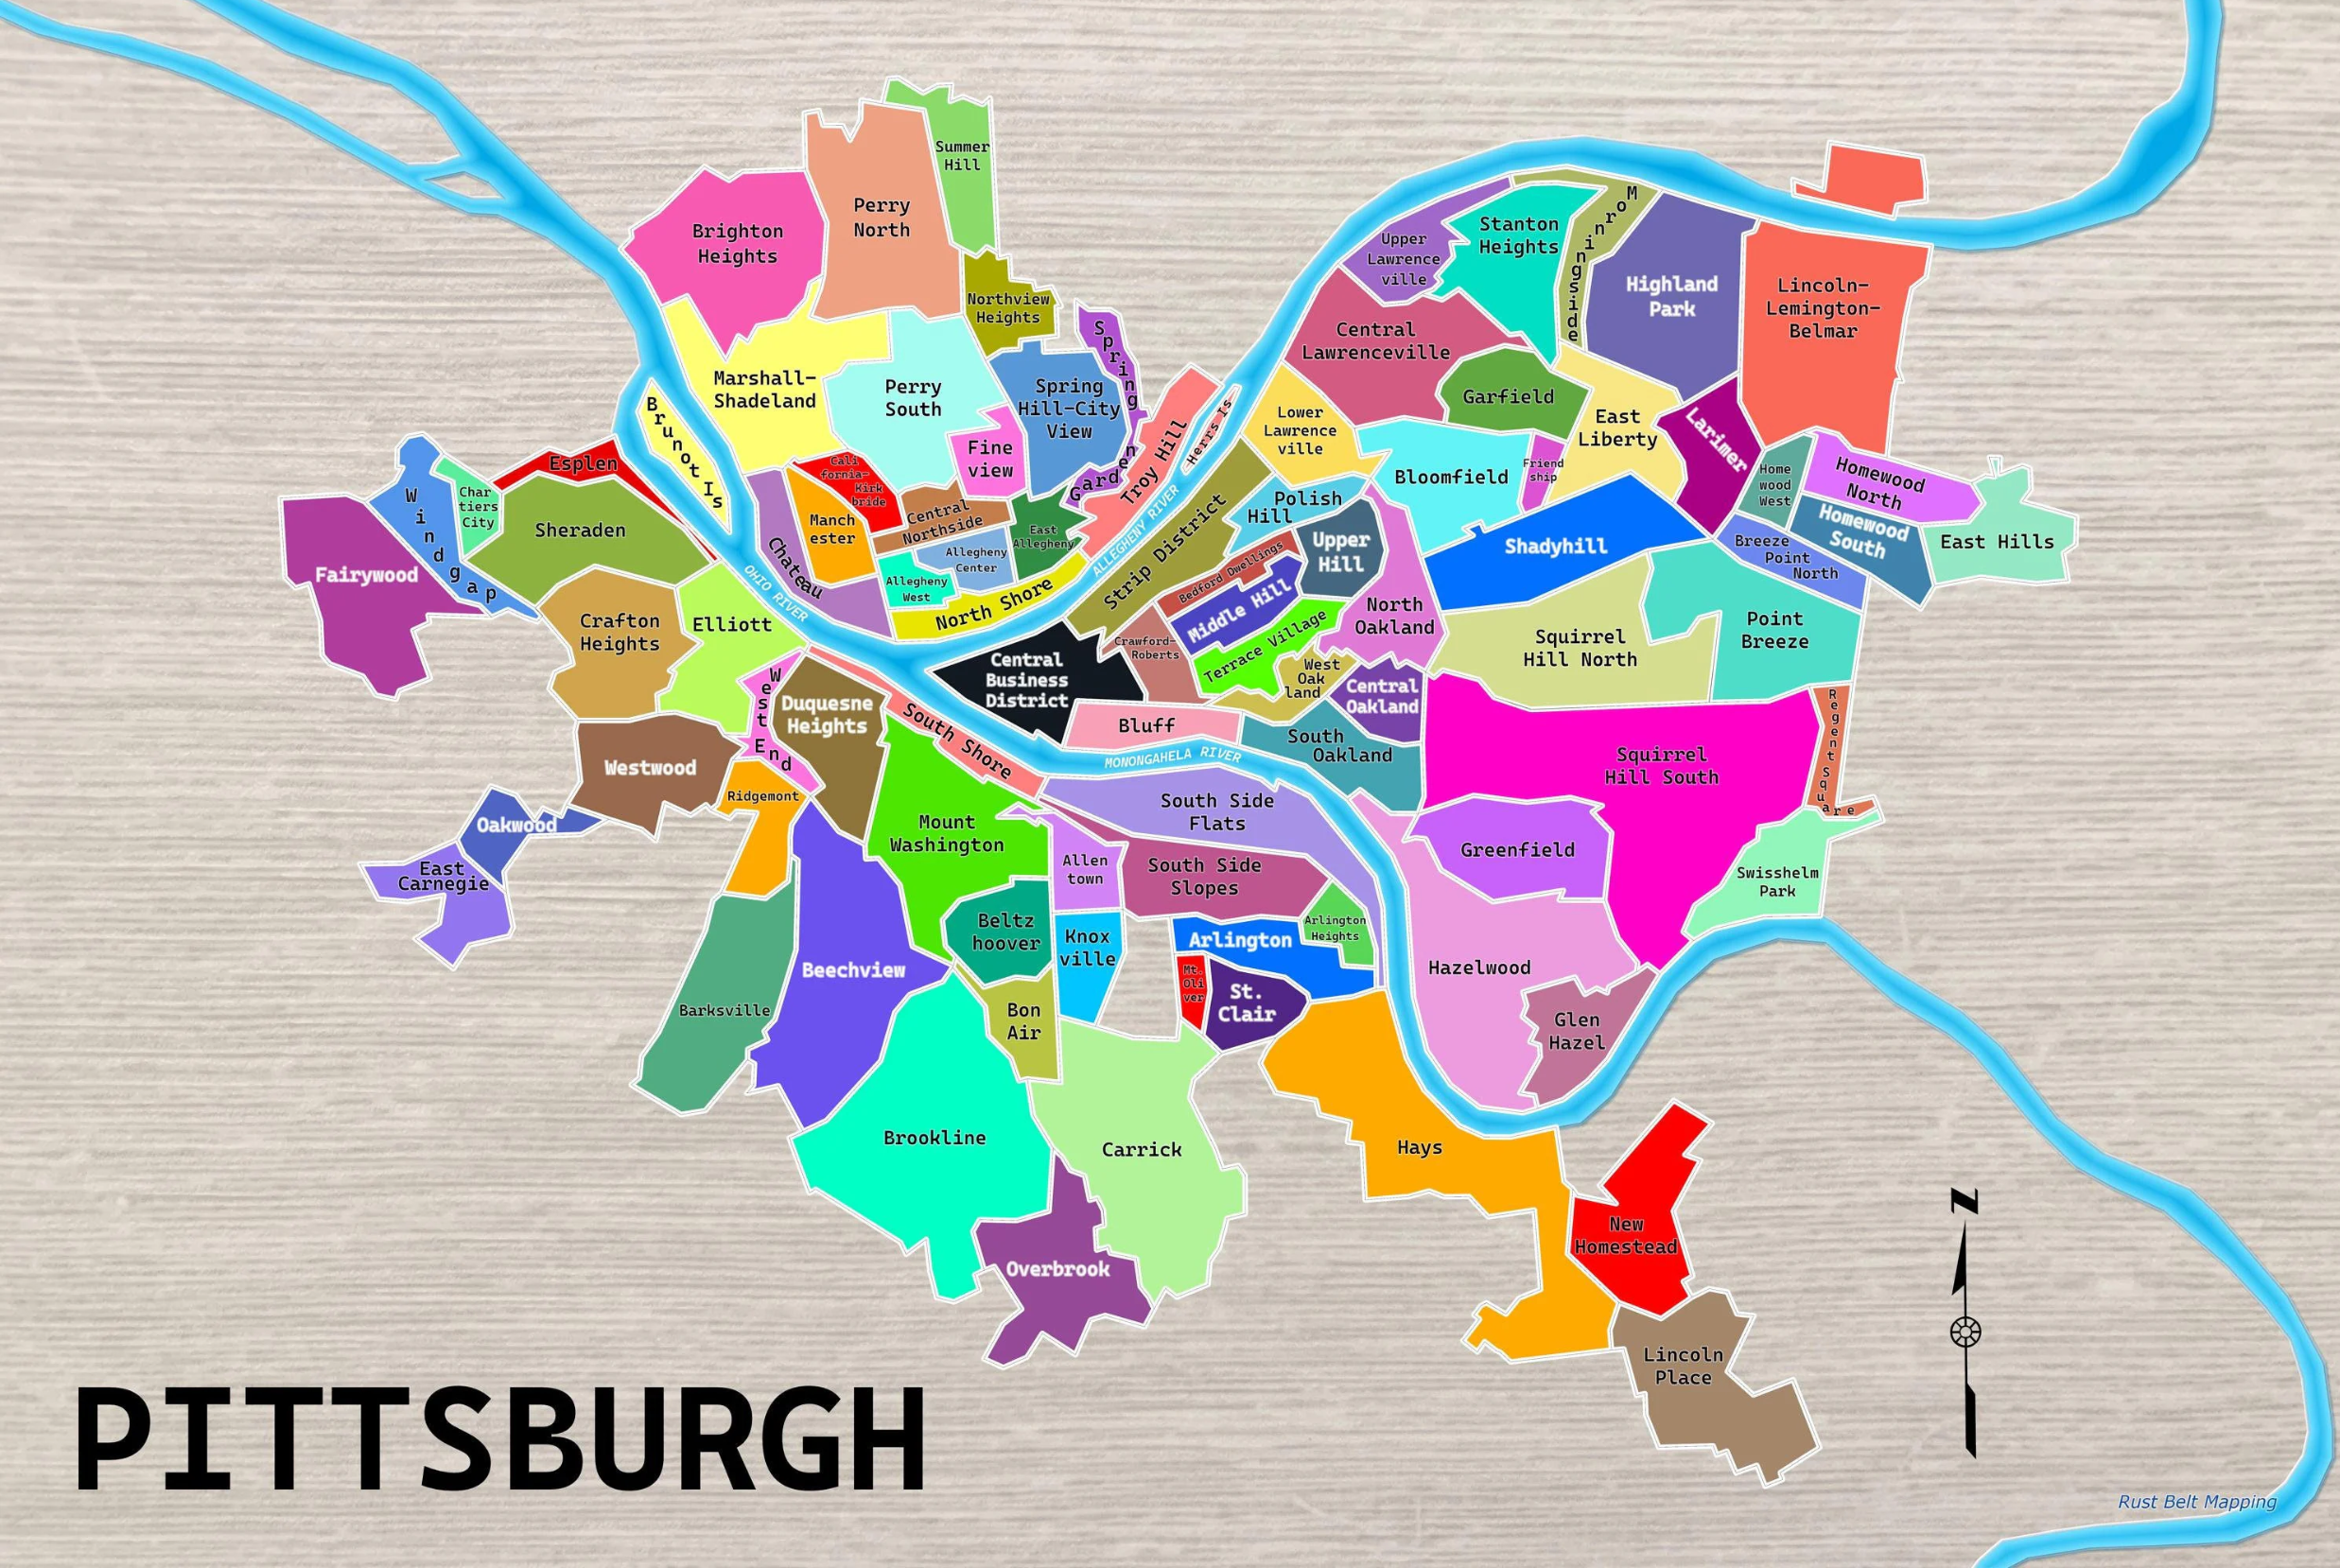
Project Brief
Goal: Identify the “best” Pittsburgh neighborhood for kids using public amenity data.
Why: Support family-friendly planning and highlight community assets.
Scope: Compare neighborhoods by access to three kid-centric amenities: pools, courts/rinks, playgrounds.
Data: WPRDC open datasets and city neighborhood boundaries.
Method: Count amenities; score pools by total capacity with a 15–1 points scheme; sum into one final score.
Outcome: Squirrel Hill South ranks first. Runners-up include Brookline and Highland Park.
Big Ideas in Computing and Information FINAL PROJECT
Overview
We define the “best” Pittsburgh neighborhood by kid-centered funness. Using WPRDC datasets, we compare three public amenities:
- pools
- courts/rinks
- playgrounds
Metric
- Courts/rinks and playgrounds: rank by raw counts per neighborhood.
- Pools: rank by total capacity per neighborhood. Convert the top 15 to points: 15 for 1st, 14 for 2nd, …, 1 for 15th.
- Final score: pools points + playground count + courts/rinks count.
Data
The following data was open-sourced from Western Pennsylvania Regional Data Center
- Basketball/Tennis Court & Rinks data set
- Pools data set
- Playgrounds data set
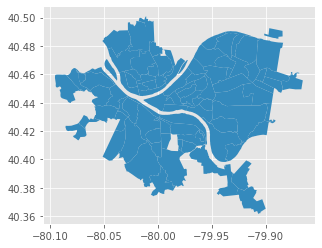
- Neighborhoods shapefile:
Neighborhoods/Neighborhoods_.shp
Base map preview:
Python Libraries Used
pandas, geopandas, matplotlib, shapely
Results
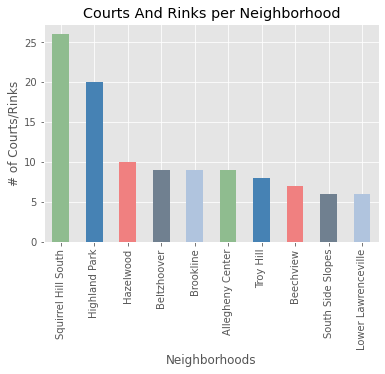
Courts and Rinks
We tally facilities per neighborhood and rank.
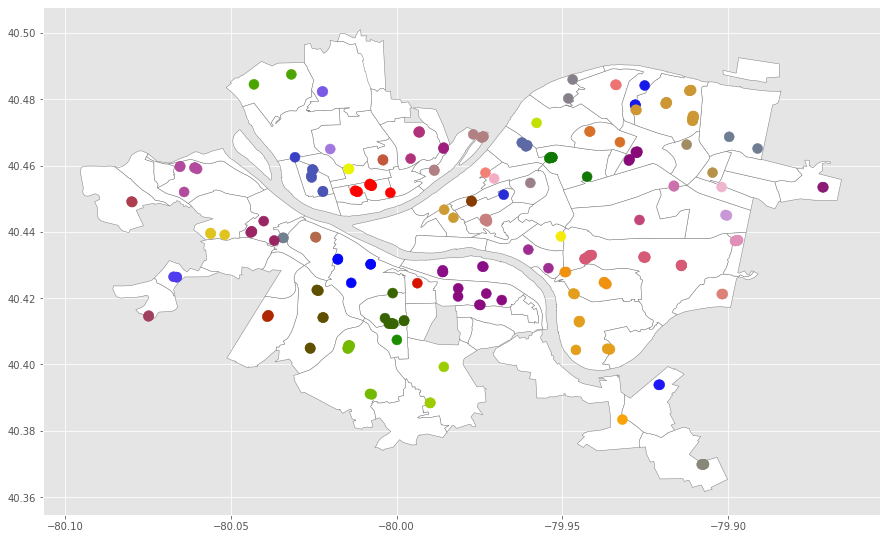
Facility locations over the neighborhood map:
Top 5 (courts/rinks):
- Squirrel Hill South (26)
- Highland Park (20)
- Hazelwood (10)
- Beltzhoover (9)
- Brookline (9)
Pools
We count pools, then emphasize capacity to reflect usable water area.
Counts:
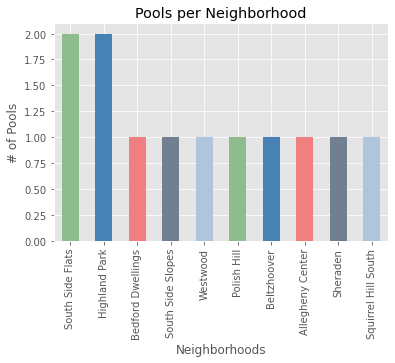
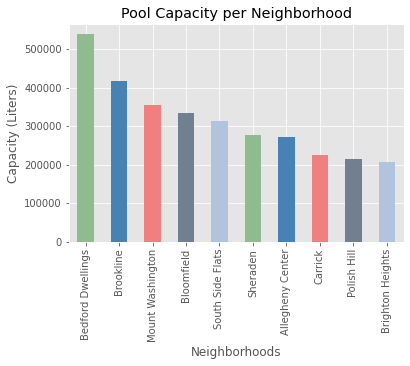
Capacity (Liters):
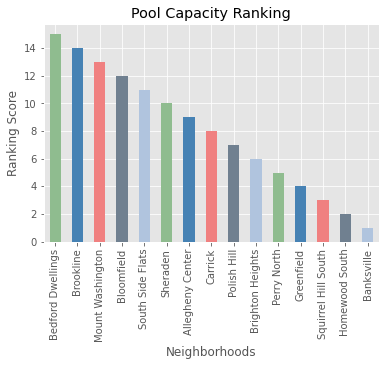
Capacity → points (In order to give these large numbers a more useful value, I gave each of the top 15 a score that we can use to choose the final funnest neighborhood.The 1st place got a score of 15, 2nd got 14, 3rd got 13, and so on until the 15th place.)
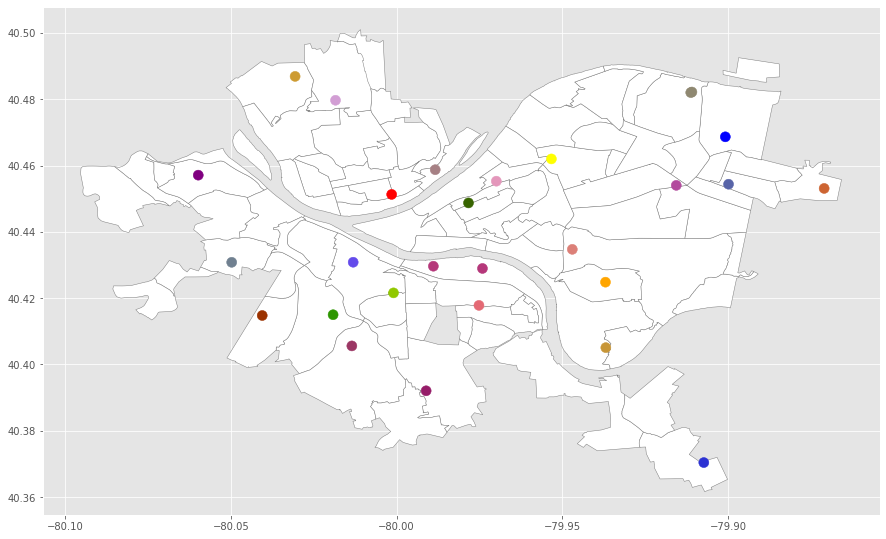
Pool locations:
Top 5 (capacity):
- Bedford Dwellings (538,000 L)
- Brookline (417,657 L)
- Mount Washington (356,000 L)
- Bloomfield (335,000 L)
- South Side Flats (312,800 L)
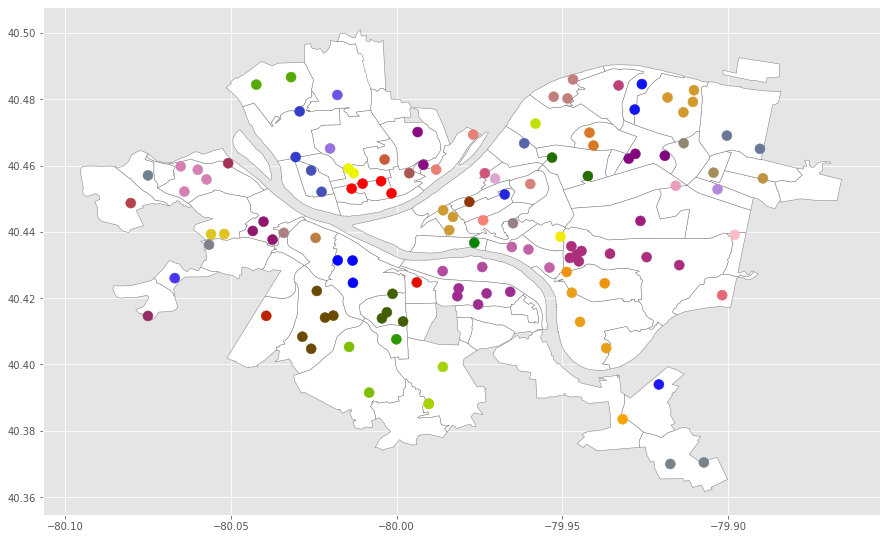
Playgrounds
Counts per neighborhood and map.
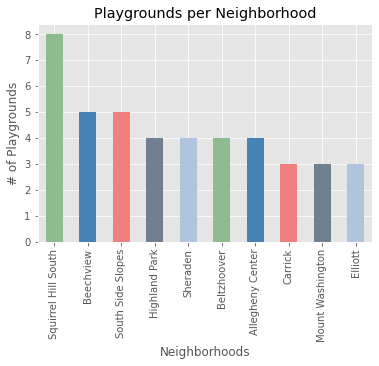
Top 5 (playgrounds):
- Squirrel Hill South (8)
- Beechview (5)
- South Side Slopes (5)
- Highland Park (4)
- Sheraden (4)
Combined Score
We union neighborhoods across datasets, then compute:
final_score = pool_points + playground_count + courts_rinks_count
Stacked comparison for the top 15:
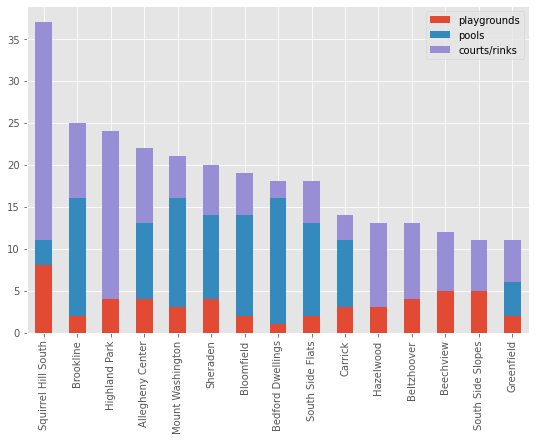
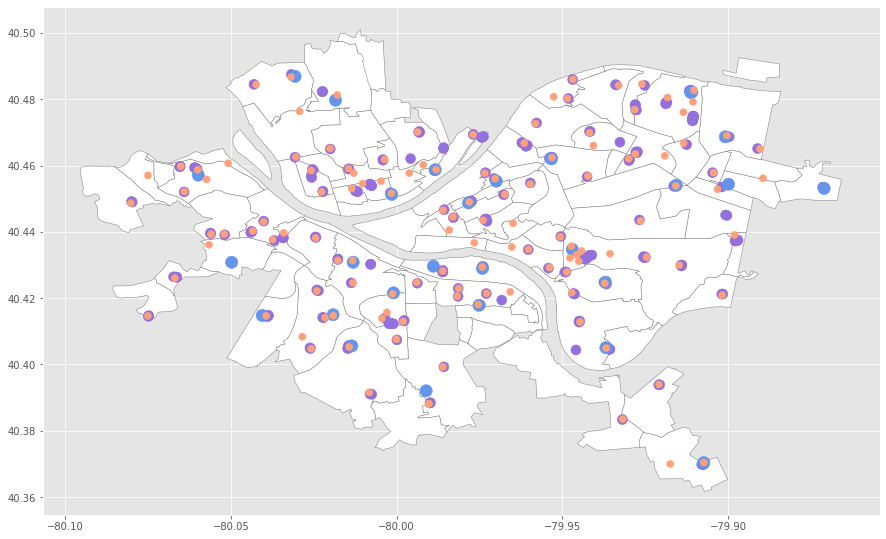
All facilities on one map Key: courts/rinks = purple, pools = blue, playgrounds = salmon.
Winner
Squirrel Hill South — 8 playgrounds, 26 courts/rinks, and a moderate pool presence.
Runners-up: Brookline, Highland Park, Allegheny Center, Mount Washington.